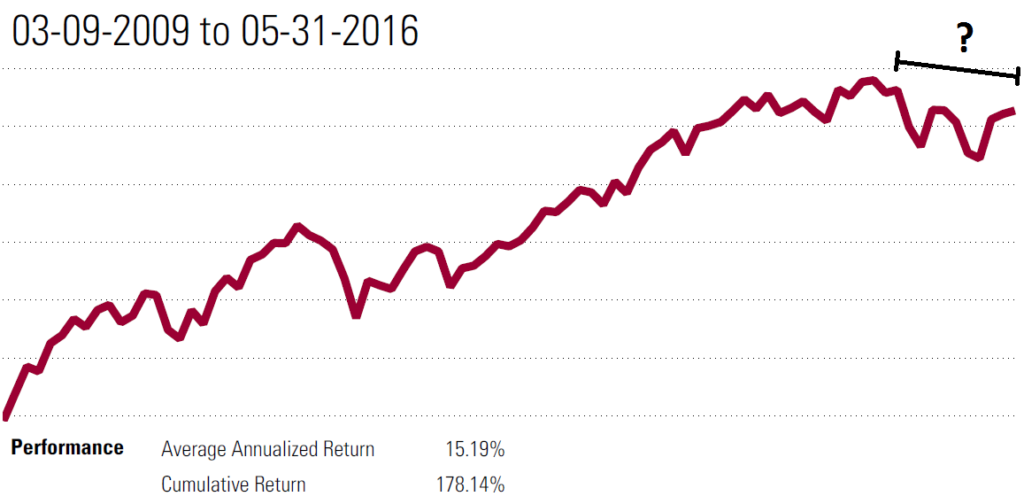
Graph: Vanguard Total World ETF (VT) since the start of the bull market on February 9th, 2009 (return data includes dividends)
What should we call the recent market history? Maybe we should call it a mini bear, a pause, a stall, or perhaps a flat line. Really it is too early to say, as it is still unclear if this is a pause within the greater bull market or early stages of a bear market.
The markets have been stalled going back to 2015. The chart above shows the market since the beginning of the bull run in 2009, and the chart below shows the market since the start of 2015 and its relatively flat performance. Why has the market been so flat over the last ~year?
Economic Drivers: Recession still appears unlikely, however increased rates of expansion appear equally unlikely. Growth has remained low, and relatively in line with expectations. Developed economies continue to expand between ~1.5% – 3% and there seems to be little indication of an oncoming change.
Political Drivers: Since the start of the “summer of Trump” political stalemate in Washington has continued. The political inaction was a positive force for the market, however uncertainty about the future environment rose which was a negative force on the market. The “smart money” liked Marco Rubio or another mainstream candidate like Jeb Bush or Scott Walker to be the republican presidential nominee, but Trump won. The “smart money” expected the Hilary Clinton machine to win the democratic nomination in a landslide, but instead self-proclaimed socialist Bernie Sanders took her down to the wire. The November elections seem to truly be a situation where anything could happen, and that uncertainty makes it difficult to be bullish or bearish.
Sentiment Drivers: Investors and general population alike appear somewhere in the pessimistic to skeptical stage of the sentiment life cycle. Sentiment has seemingly remained in line with expectations of low economic expansion numbers.
The market seems to have paused as major drivers remained collectively neutral. It is difficult to say the timing for when the pause will end. The positives and negatives continue to cancel one another out. Over short-term periods expect the market to remain wildly volatile, with upside and downside corrections likely.
Eventually there will be a major disconnect between expectations and reality which will push the market.
Either way, right now there is not enough evidence to support forecasting a bear market or moving a portfolio to a defensive position. When in doubt, remain bullish and take comfort in knowing that the most dangerous investing move is betting against the market. Take comfort in knowing that the superior long-term returns of stocks does not exclude the down periods, it accounts for the ups and the downs.
Graph: Vanguard Total World ETF (VT), date range 01/01/2015 – 05/31/2016 (return data includes dividends)
US stocks have historically performed better in the second half of a presidential term than the first half. Also, there has been more variance in stocks performance in the first half of a presidential term than the second half.
The third year of a presidential term has historically been the best performing year for stocks.
Why is that?
First keep in mind the best opportunity to pass landmark legislation is in the first two years of a presidential term. In almost every case the president’s party loses power in the mid-term elections, and therefore loses the power to pass major legislation.
Now let’s think about the fourth year of a term, the election year. The president is trying to get re-elected or is trying to get his successor elected, and therefore will not try to pass any major legislation. The president’s party has (most likely) lost power in the mid-term elections to the opposition and therefore is not able to pass any major legislation. People of both political spectrums tend to be optimistic that their candidate will win the upcoming election. Summary of the fourth year, political gridlock/status quo, combined with a general feeling of optimism in both political spectrums. (Based on the polls, we do not have that optimism this year)
In the inaugural year of a term about 50% of the country is dissatisfied with the election results and is pessimistic. The other 50% of the country was really optimistic, but quickly becomes saddened to realize that the conservative or liberal that was elected is not nearly as conservative or liberal as they had hoped for. Also, as mentioned above the politicians are passing or talking about passing major legislation leading to uncertainty. Remember that legislation is some form of redistribution of money and/or property rights, and the markets do not like that.
The second year tends to be more of the same, perhaps without the degree of pessimism and/or gap between expectations and reality. Legislation is actually being passed. This means change and uncertainty, and redistribution. The markets do not tend to like those things.
Lastly, in the third year of the presidential term the president has lost power to pass major legislation because of the mid-term elections and the uncertainty of the upcoming election is still far enough away. This sets up for a perfect year of inaction, status quo, stalemate, whatever you want to call it; markets tend to like it.
Always keep in mind that politics is only one of a myriad of market drivers, and investment maneuvers should never be based solely on the political environment.
I am consistently mystified by the media attention given to figures like Kim Kardashian. Why and how does this happen?
I have similar feelings when I see the reporting on the Dow Jones Industrial Average (or the DJIA, or simply the Dow). Way too much attention is paid to the Dow. Whether it is in the media or amongst laypeople, it seems everyone loves to talk about the level of the Dow or how many points it moved as if it is indicative of anything.
Paying attention to the Dow is kind of like following what is happening with Kim Kardashian, it is an interesting curiosity and diversion, but hard to put into context what the real relevance is. The Dow is an extremely narrow index of stocks (only 30 firms, all US) and it is “price weighted” making it a very poor representation of US stocks let alone the global stocks.
First let’s talk about the narrowness. As I mentioned before, the Dow is comprised of only 30 US firms. There are thousands of US stocks out there, and the Dow index only accounts for 30 of them. Granted they are really big companies, so at any given time the Dow may account for ~20% – 30% of the total value of US stocks. That’s not a very big representation of US stocks period, and it is especially poor when compared to the S&P 500 index which accounts for more than 80% of the total value of US stocks.
No investor should ever be fully invested in only one country, even if that country is one as big economically as the US. Investing globally is the easiest form of diversification, and the Dow is 100% US stocks.
The firms that make up the Dow are arbitrarily selected. Currently Apple (AAPL) and Microsoft (MSFT) are in the index, but Alphabet Inc. (that’s Google, GOOGL) isn’t in. JP Morgan (JPM) and Goldman Sachs (GS) are in the index, but Bank of America (BAC) and Wells Fargo (WFC) are out. Why? I couldn’t tell you, but I am sure if you do a little digging you can find some canned vague explanation for why the index holds one stock vs. another.
Lastly the Dow is a “price weighted” index meaning that stocks with a higher share price are given more weight (influence) on the performance of the index. Using price weighting Goldman Sachs (GS) with a share price ~$160 has more than double the impact of Wal-Mart (WMT) with a share price of ~$70 even though Wal-Mart is almost three times the size.
Good stock market indices are weighted based on market capitalization (the size of the company).
The attention given to the Dow is overdone. The Dow should not be used as a benchmark for the individual investor, and it should not be viewed as a good representation of the markets, US markets, or even large-cap US stocks.
 Graph: Vanguard Total World ETF (VT) since the start of the bull market on February 9th, 2009 (return data includes dividends)
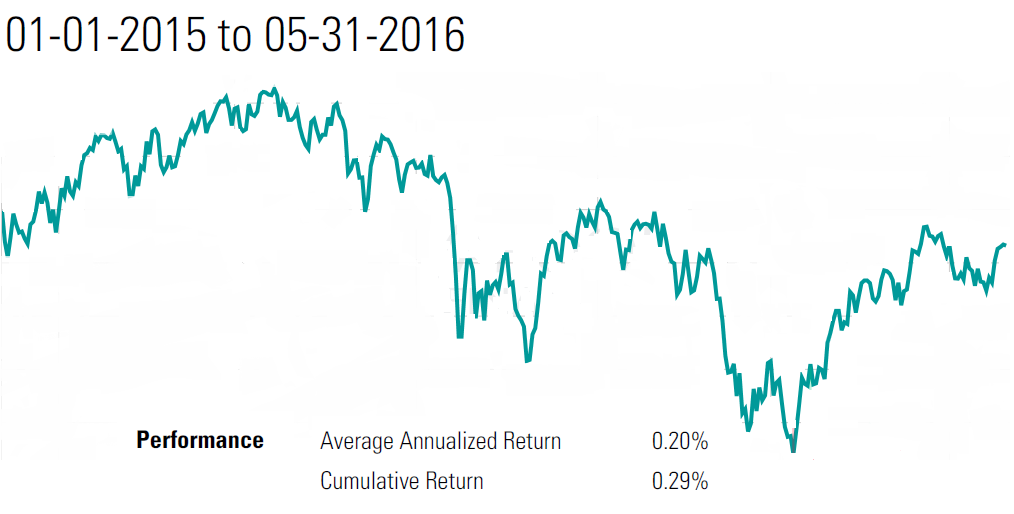 Graph: Vanguard Total World ETF (VT), date range 01/01/2015 – 05/31/2016 (return data includes dividends)