With a new administration set to take control in 2025, investors are thinking about tariff policy and grappling with potential outcomes.
The greatest fear is that new broad-based tariffs will increase inflation, lead to rising interest rates, and potentially trigger a recession. If the three aforementioned were to simultaneously happen, then we’d likely repeat 2022 in capital markets. As you remember, US stocks and bonds both had double digit negative returns for the year. This was a situation that had not occurred since the 1960s.
With deceptive information being spread in media outlets, I think it is worth reviewing how/if tariffs really cause inflation. This is not a political commentary for or against tariffs. There are arguments separate from economics that could make tariffs sound/unsound policy. One might argue the merits of tariffs for geopolitical reasons, national security reasons, or as a negotiation tool. We will stick to economics.
If the intent is for economies to grow and produce at their most efficient, there would be no tariffs. Goods and services would be produced where they are most efficiently produced. Tariffs distort the natural market and create outcomes that otherwise may not have occurred and do so at different prices.
If the NFL decided it wanted the Cowboys to be more competitive with the Packers, when the two teams played, it might not allow the Packer players to not wear cleats, and gloves. Maybe the Cowboys would automatically receive the first and second half kickoffs. In this scenario, the outcome might not be different, but the final score would certainly be different, and the product (Packer performance) would be inferior for the price.
Why would any country or anyone be in favor of tariffs if they create lower quality and/or higher priced end outcomes? The quick answer is that if you are a Cowboys fan, you might care more about the Cowboys than you do about having the best, most efficient, and meritocratic outcome. The argument is that the cost of tariffs is spread across all consumers, but the benefits tend to favor lower income, lower skilled, production workers. Traditionally, democrats have been more pro-tariff because it was seen as pro-worker, republicans have typically been more anti-tariffs seeing it as anti-free market.
Enough about economics, what do tariffs mean for inflation (and markets)? Tariffs can create a one-time short-term price bump for goods/services. However, static tariff policy does not continually increase inflation, and over the long-run tariffs have no effect on inflation.
Let’s say we have Jack, and Jack has one dollar to spend. He only wants to buy two items. He buys $0.50 worth of butter, and that gets him one stick of butter. He buys $0.50 worth of ammo, and that gets him two boxes of ammo.
Then tariffs happen, but Jack still only has $1.00. Now he buys $0.75 worth of butter, and $0.25 worth of ammo. Jack still gets his one stick of butter, but now at $0.75. Jack buys $0.25 worth of ammo, but instead of getting two boxes, he only gets 1/2 a box. He spends the same total but gets less. This is the short-term bump in action. Before he got two boxes of ammo and one stick of butter for $1.00 but now, he needs $1.75 for the same goods. Inflation, right?
Not so fast my friends. Jack’s demand for butter was $0.50, and same for ammo to start with. However, his demand for ammo reduced to $0.25 when the price of butter rose. Over the longer run we know that when demand falls, prices fall too. In our example, over the long run the price of ammo would come down, because there was no increase to the money supply and the demand for ammo decreased.
The Bottom Line: Unless there is an increase in the money supply or rate of money supply expansion, tariffs alone, are not inflationary. Therefore, if interest rates rise, it is not a result of tariff policy. Tariffs can and presumably would reshape the economic playing field. Depending on what team or outcome you are rooting for, that reshaping could be positive or negative.
Wyatt Swartz
Written 12/23/2024
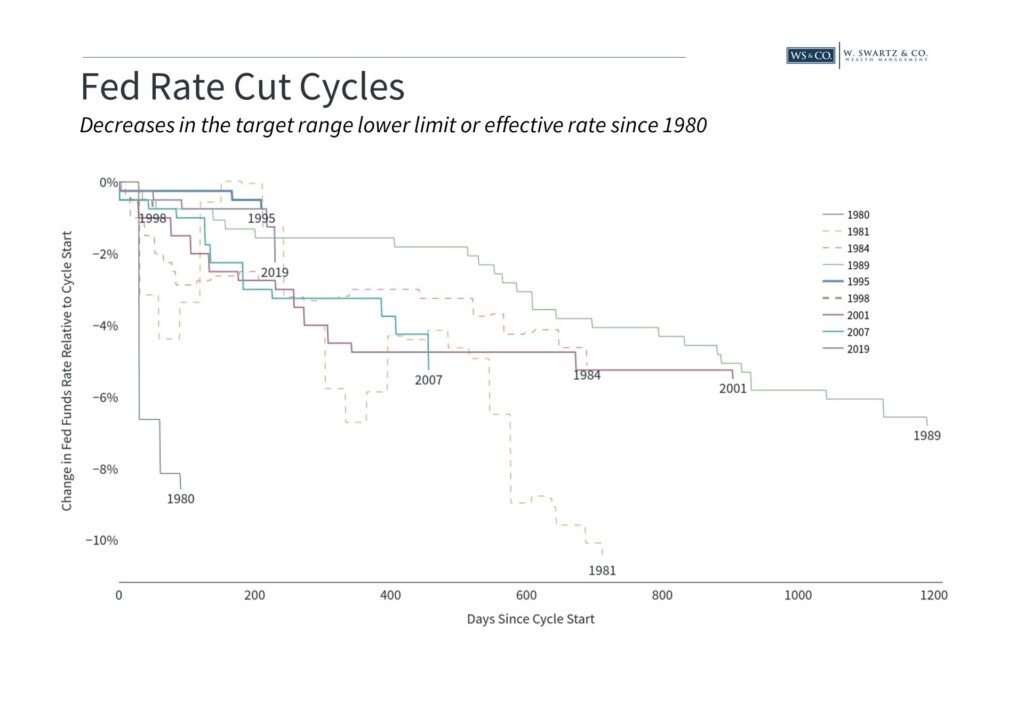
The Federal Reserve’s interest rate decisions remain the central focal point for markets. The timing and size of rate cuts are the subject of debate, but why the bank is cutting rates and how the full rate cut cycle might playout are far more important. The implications are not as straightforward as they might seem, and market expectations have shifted dramatically over the past year. What should investors know about how rate cuts have historically impacted the economy and markets?

The Fed typically lowers interest rates in response to a weakening economy, because makes borrowing cheaper for individuals and companies, while also increasing the incentive to spend rather than save. In theory, this boosts growth and supports the economy, especially during recessions and financial crises. Over the past few decades, the Fed made dramatic rate cuts during the early 2000s dotcom bust, the 2008 global financial crisis, and the pandemic in 2020.
The impact of rate cuts on the economy and market behavior is easily misunderstood. Lowering rates is intended to promote growth, but doing so during an economic crash means that a recession and bear market are likely to follow, or already underway. This means that rate cuts are historically correlated with poor market returns even though the rate cuts were in response to, rather than the cause of, these challenges.
Conversely, rate hikes are typically seen as slowing the economy, they often occur during economic booms and bull markets as the Fed slowly pumps the brakes. Thus, counterintuitively, rate hikes have historically corresponded to strong market returns.
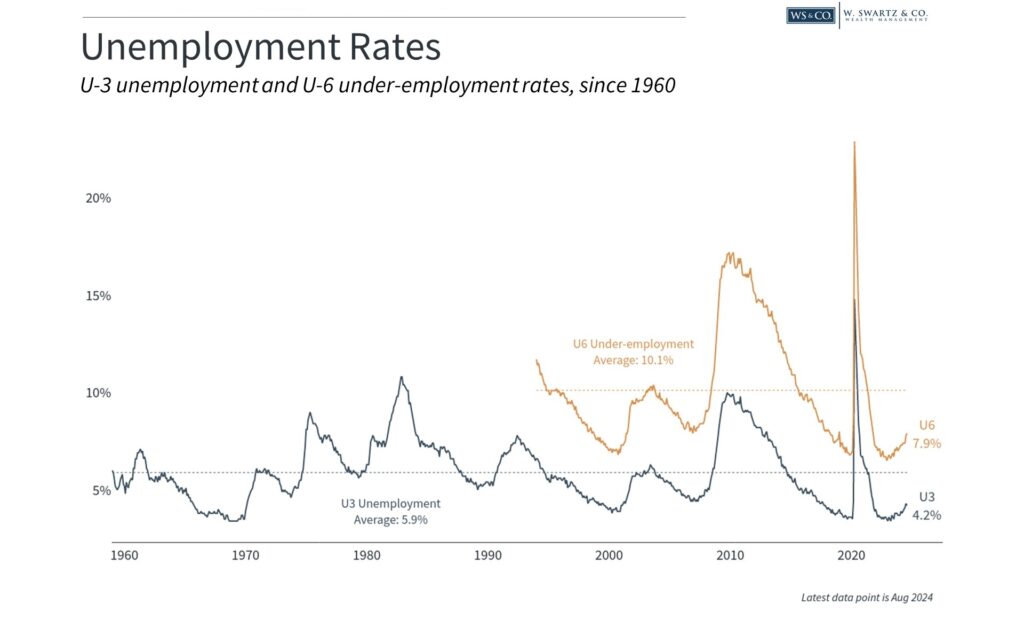
Today, the Fed is not battling a sudden economic collapse or financial crisis but is navigating a period of slowing growth, decreasing inflation rates and a weakening but still strong labor market. In other words, the current situation is different from periods of emergency rate cuts. This is why the rationale for lowering rates matters when considering how they might impact markets in the months and years ahead.
Perhaps a more applicable example is the 1994-1996 rate cycle, when the Fed raised rates to combat inflation fears before lowering them again shortly thereafter. Periods like these are often referred to as “soft landings” since the Fed arguably managed to raise and lower rates without triggering a recession. There was initial shock to the bond prices – just as there was in 2022 – markets eventually responded positively to rate cuts once the economy stabilized.

The Fed’s dual mandate, as described in the 1977 Federal Reserve Act, is “to promote maximum employment and stable prices.” Today, this is interpreted as returning the inflation rate to 2% while ensuring the economy continues to grow steadily.
From 2009 to early 2020, inflation rates were below 2%, allowing the Fed to keep interest rates exceptionally low and corresponding with a strong job market. In contrast, the inflation of the past few years has required the Fed to make tough choices between price stability and jobs.
Fortunately, inflation numbers have improved since its peak in 2022. This doesn’t mean that prices are going back to pre-2022 levels, only that the speed that prices are rising (the dollar is being devalued) is much slower. The latest Consumer Price Index report showed that rates continued their gradual slowing in August, with the headline index rising 2.5% year-over-year. However, the Fed is hesitant to declare victory since core CPI, which excludes food and energy prices to measure the underlying trend, experienced an uptick to 3.2%. This was primarily attributed to stickiness in housing prices.
Monetary policy works with “long and variable lags.” Which means, if the Fed waits for inflation to be all the way back down to 2%, it may have waited too long. The cost of doing so would be an over-tightening of the job market. Thus, the recent softening in the employment data provides further support for reducing rates.

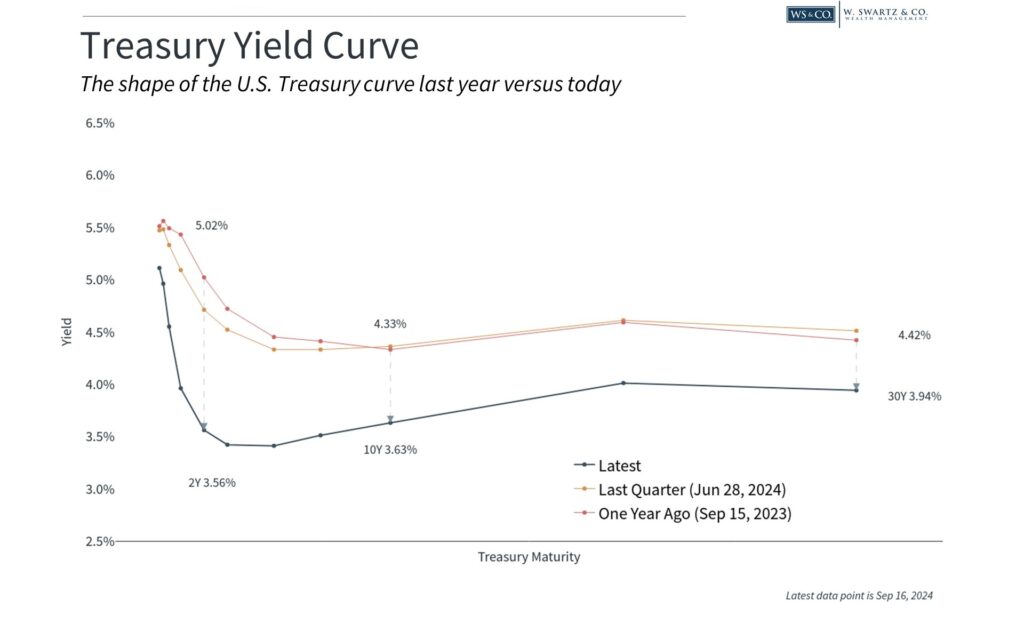
Given these economic trends, most economists and investors believe the Fed will cut rates a few times this year and throughout 2025. Bond yields have responded with the yield curve “dis-inverting” for the first time since the rate hike cycle began in 2022. This is because short-term interest rates, which are tied to Fed policy, have begun to fall while long-term interest rates, which are tied to economic growth, have not declined as much. This results in an “upward-sloping” yield curve which is often seen as positive for the economy.
Lower rates have been positive for both stocks and bonds across history. Bond prices move in the opposite direction of bond yields, which is why many bond indices have rebounded in recent weeks.
For stocks, lower interest rates mean that businesses have access to cheaper financing for investment and expansion. When it comes to the math of valuing companies, lower rates mean that future cash flows are discounted less, which can result in more attractive prices today. Of course, the market never moves up in a straight line, and investors should always be prepared for volatility.
The bottom line? Understanding why the Fed is cutting rates and the environment surrounding the moves is as important as the policy moves themselves. Currently the environment is slowing, but still positive economic growth, and falling inflation rates. If that remains true, it would be positive for capital markets.
Wyatt Swartz
Tuesday September 17th, 2024
A few weeks ago, I wrote a newsletter outlining the current mathematical challenge facing US stocks. To summarize: US stocks are unfavorably priced relative to history, US stocks are unfavorably priced relative to projected future earnings, and US stocks are unfavorably priced relative to bonds (& other fixed income securities).
Since that writing, stocks had significant declines with a strong rally this week.
Given circumstances, portfolio adjustments should be considered (in some cases already implemented). Any moves are designed to provide some level of defense should we see declines in stocks, but still capture the majority of the upside if markets rise.
This conversation is not relevant to all investors, or all investment accounts. Let’s establish where this is relevant.
- Taking Withdrawals or Nearing Time (Retired & near Retirement) – Investors consistently taking withdrawals or nearing the point they will be.
- Non-retirement Funds – Many investors have liquid, taxable investment accounts with different goals/objectives from their retirement funds.
- Market Fatigue – Markets went on positive tear 2009 to 2020, during which volatility remained low. The 2020s have been a much more challenging environment for investors. 2022 was especially hard for retired investors, because we experienced a bear market in stocks and bonds. Rather than putting the car in park, sometimes investors need to take the foot off the gas a little. Better to get there 5-minutes later, than not get there.
2009 to 2020 was a very strong period for stock returns, and it was a period of extremely low interest rates. This made fixed income assets generally unappealing and led to the term “TINA” when describing the market environment, which stands for: There Is No Alternative. The implication was that investors were either in stocks or not invested, because fixed income was not providing a meaningful return above cash.
The world is different now. Fixed income assets can give investors meaningful positive returns, while having much lower short-term volatility than stocks. One might say that the 60/40 portfolio is back! Wall Street has described the situation as a “TARA Market,” which stands for: There are reasonable alternatives. Over the long-term stocks will continue to have superior returns vs. fixed income assets, but they aren’t only game in town anymore.
Now if you are reading this, and my last newsletter and thinking “how can we play defense if stocks take another downward tumble,” then see our below.
- Increase Fixed Income Holdings – Meaningful returns with lower volatility.
- More Active vs. Passive Holdings – Active funds have been unfairly treated over the last ~15-years. While it is true that in any calendar year only about half of active funds outperform their stated benchmark, they do better when/if markets go down.
- Value/Dividends/Hedged – Owning stocks that are value priced, pay high dividends, or have some hedging mechanism may underperform broad indices in a rapidly rising market, but typically provide substantial cushion in down or flat markets. The goal here is to capture 60-80% of the upside, with only 40-60% of the downside.
Let me know if you have any questions. Talk soon.
Wyatt Swartz
Written November 3rd, 2023
